A Window Into the Plant: Watching a Gas Leak Unfold in Real Time - Part 4
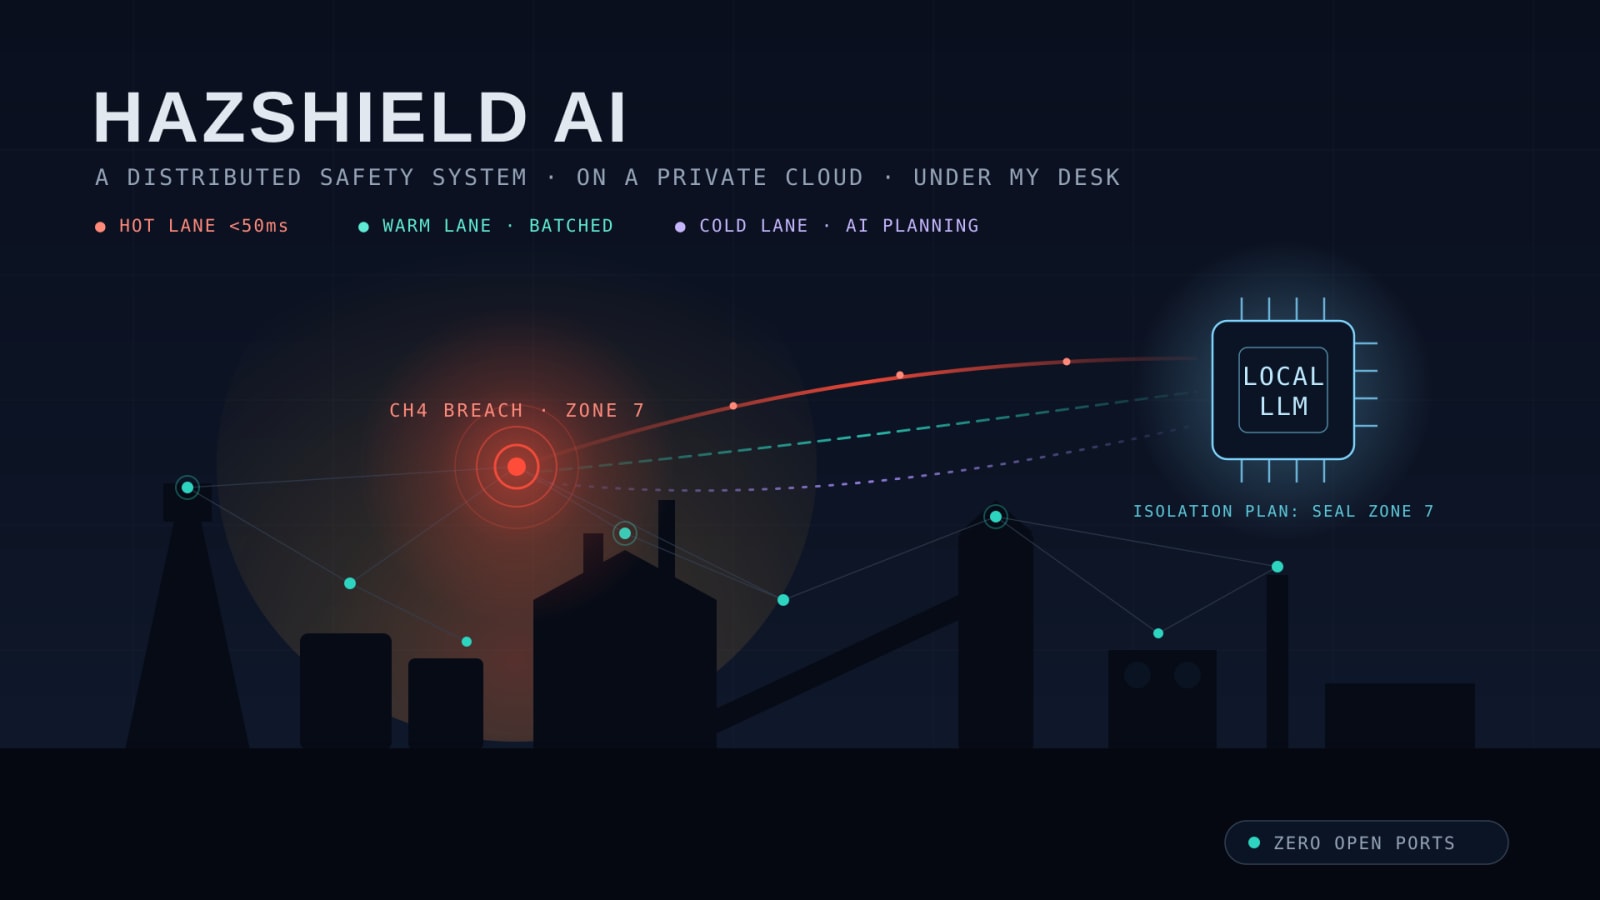
A Window Into the Plant: Watching a Gas Leak Unfold in Real Time
Three parts into this project, the plant could sense, remember, and think. It ingested ten thousand readings a second, folded emergencies into incidents, and wrote isolation plans with a local language model. And all of it was invisible. Every proof I had lived in a journal tail or a SQL query. If I wanted to show someone what the system did, I read them log lines.
That is a bad way to demonstrate a control system, and a worse way to run one. So this part builds the window: a live control room, on a public URL, where you watch the plant. When a gas leak starts, you see it start. When the machine writes a plan, you read it seconds later. No queries, no logs. Just the plant, lit up.
The Wrong Tool, Twice, Before the Right One
The first instinct for "live web dashboard" is WebSockets. I didn't use them, and the reason is a good example of matching the protocol to the actual need.
The control room only ever listens. It watches the plant; it never sends the plant a command. That is a deliberate safety position, which I'll come back to. But it also settles the protocol question: if data only flows one direction, WebSockets (which are bidirectional) are more machinery than the job needs. Server-Sent Events are the one-directional tool. They ride ordinary HTTP, so they pass through the Cloudflare tunnel and the reverse proxy without special handling. The browser's EventSource reconnects itself when the connection drops. And you can debug the whole thing with curl, because it's just a long-lived HTTP response with data: lines. For a one-way live feed, SSE is less code and fewer failure modes than a WebSocket.
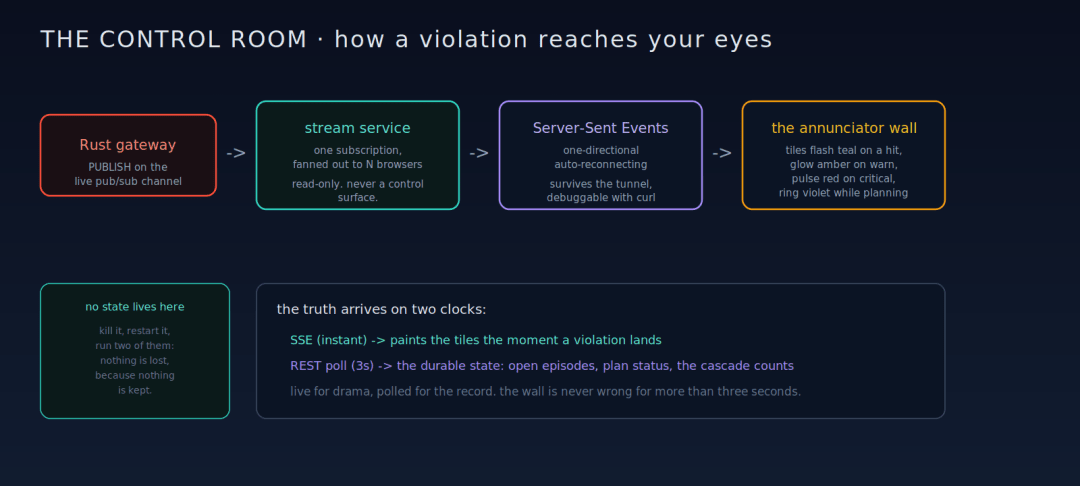
The second wrong instinct is to have every browser open its own subscription to the message broker. That doesn't scale and it couples the browser to the internals. Instead, a small stream service holds one subscription to the gateway's live channel and fans each event out to every connected browser. Add a hundred viewers and the broker still sees one subscriber. The service itself keeps no state: subscribe, relay, forget. You can kill it, restart it, or run two of them, and nothing is lost, because nothing is kept. Same principle as the workers three parts ago. Cattle, not pets.
Two Clocks
Here is the subtle design choice that makes the wall feel alive without ever lying.
There are two kinds of truth on the screen, and they arrive on two different clocks. The live feed (a violation just crossed a threshold, right now) comes over SSE, instantly, and its only job is to make a tile flash the moment its zone is hit. It is drama. It is not the record.
The record (which episodes are open, what state they're in, whether a plan is generating or ready, the running cascade counts) comes from a plain REST endpoint the browser polls every three seconds. That is the durable truth, read straight from the database, and it is what the tiles' steady colors and the episode board reflect.
Live for the drama, polled for the record. A flash tells you something is happening in that zone; the poll, a beat later, tells you what it actually means. The wall is never wrong for more than three seconds, and it never shows you a flicker it can't back up with committed state.
The Annunciator Wall
Real control rooms don't use dashboards full of line charts. They use annunciator panels: a grid of labelled tiles that are dark when all is well and illuminate, by color and blink, when something needs attention. I borrowed the metaphor directly, because it is the correct one for glanceable safety state.
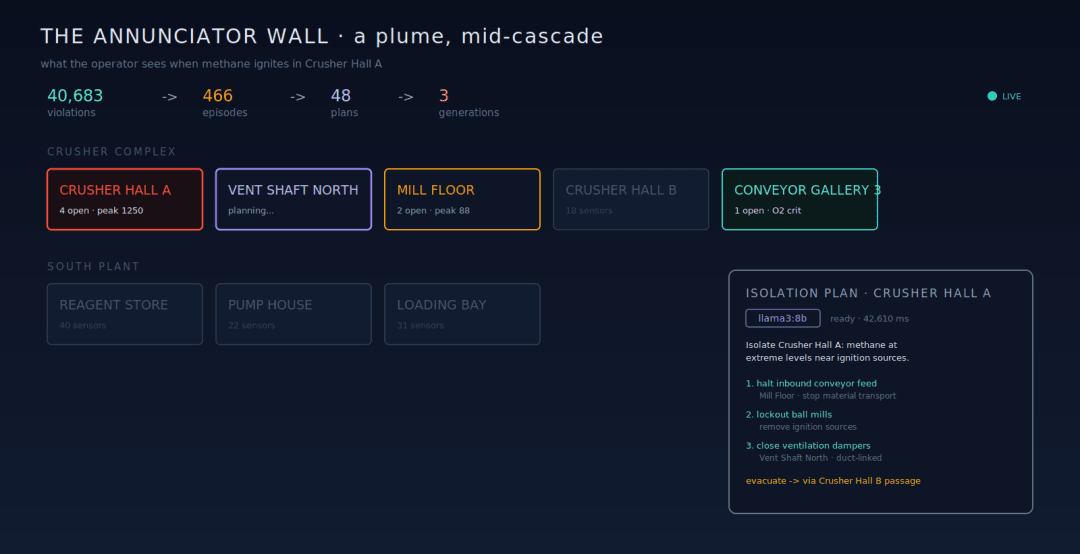
Each zone is a tile. Dark and quiet when nothing's wrong. It flashes teal for a heartbeat when a live violation lands in that zone, the SSE clock. It glows steady amber when it holds a warning-level episode, the watchlist. It pulses red when something critical is open. And it grows a violet ring while the cold lane is writing a plan for it. Click a lit tile and a drawer slides out with the isolation plan itself: the model that wrote it, the ordered steps, the evacuation route, the ventilation note.
There's one flourish I couldn't resist. On load, every tile flashes once, in sequence: a lamp test, exactly like the bulb-check a real annunciator panel runs at power-up to prove none of its lights are burned out. It's pure theatre. I kept it anyway, because the whole point of this part is that the system is finally something you can see, and a panel proving its own lights is the most honest possible way to say "everything here works, watch."
Read-Only by Construction
I said the control room only listens. That is not a limitation I ran out of time to fix; it is a rule I enforced in code, and it is worth being explicit about.
Every database query the stream service makes is a read. There is no endpoint, anywhere, that lets the browser acknowledge an alarm, clear an episode, or override a plan. The dashboard cannot mutate the system, because a public URL must never be a control surface. If you can watch the plant from the open internet, you must not be able to touch the plant from the open internet. Actuation, the part where a decision changes something physical, belongs behind authenticated, audited paths, never an anonymous browser tab.
In an interview I'd frame it this way: the read-only-ness isn't a smaller version of a real control room, it's the correct security boundary for the surface I actually exposed. The interesting engineering was making a compelling window that is also an inert one.
Watching It Happen
Then the demo that justifies the whole part. I opened the wall on one screen, and on another I ignited a methane plume in the simulator: a couple of thousand readings a second, one zone's sensors ramping past critical over three minutes.
And the wall told the story by itself. Teal flickers scattered as the first violations arrived. Then Crusher Hall A's tile went amber, then red, and began to pulse. A violet ring bloomed around it as the cold lane picked up the plan request. Seconds later the ring cleared and a plan badge landed on the episode board. I clicked it, and there was the drawer: llama3:8b, ready, forty-two seconds, a nine-step isolation plan that named the methane, halted the conveyor feed, locked out the ball mills, closed the dampers toward the vent shaft, and routed the evacuation through the adjacent hall.
The header counters ticked the compression cascade live as it happened: tens of thousands of violations, hundreds of episodes, a few dozen plan requests, a literal handful of real model generations. The same funnel from Part 3, except now you don't audit it after the fact with SQL. You watch it drain in real time.
Nobody had to read me a log line. The plant showed me.
What Phase 4 Taught Me
Match the protocol to the direction of the data. A one-way feed wants a one-way protocol; reaching for the bidirectional tool out of habit buys you complexity you'll pay for later. Separate the live signal from the durable record, and let each keep its own clock. The flash and the fact don't have to arrive together, and pretending they do is how dashboards end up showing things that never committed. And decide, on purpose, what a public surface is allowed to do. The most important feature of this control room is the endpoint that doesn't exist.
Next Time: Proving It, On Demand
The plant can now sense, remember, think, and be watched. What's left is the argument that it's operable: metrics and traces that make every layer legible, and chaos drills that break the system on command and show it recover. The last part is about turning "it works" into "watch me break it and bring it back."
The mini PC under my desk continues to run a chemical plant that does not exist, and remains completely unbothered.